Abstract
Interactive Maps
I have experience making interactive maps with ArcGIS Online and Python.
ArcGIS Online Maps
Python Map
Figure 1 shows a sample bar chart generated with Matplotlib.
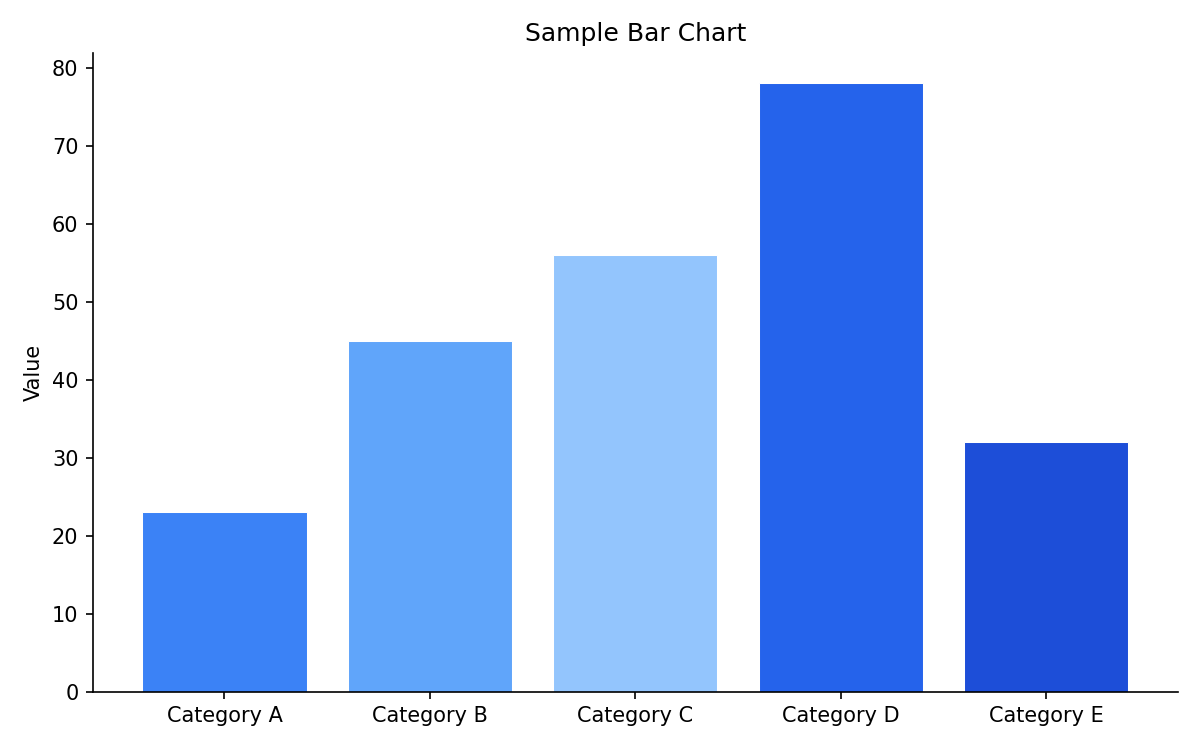
Figure 1:A sample bar chart showing values for five categories.
Sample Dropdown
2025
Item 1
Item 2
Item 3
2024
Item 1
Item 2
Item 3
Running the Example
import numpy as np
import matplotlib.pyplot as plt

x = np.linspace(0, 2 * np.pi, 100)
y = np.sin(x)

fig, ax = plt.subplots()
ax.plot(x, y)
ax.set_xlabel("x")
ax.set_ylabel("sin(x)")
ax.set_title("A Simple Plot")
plt.show()
Summary
This example demonstrated the basic workflow.